
Beyond the Dashboard: Interpreting Hive Health Data to Predict Swarming
Collecting inspection data isn't the same as reading it. Here's how to interpret hive health records — and use a swarm risk score — to catch swarm signals before your bees leave.
Beyond the Dashboard: Interpreting Hive Health Data to Predict Swarming
More beekeepers are logging inspections digitally than ever — but collecting data and reading it are two different skills. A dashboard full of past inspections doesn't help you if you only look at it after the swarm is already in a tree three yards over. The real value of hive records shows up when you learn to read the pattern building across several inspections, not just the most recent one.
Why Swarming Catches Even Careful Beekeepers Off Guard
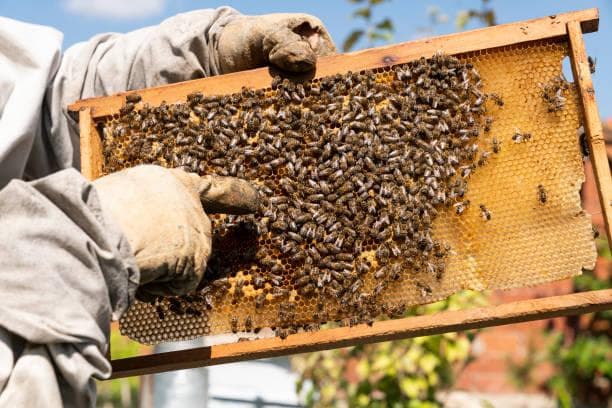
Close-up of honeycomb showing brood cells and a queen cup
Swarming isn't a sudden event — it's the end point of pressure that's been building for weeks. A colony that's outgrown its space, a queen slowing her laying rate, and a strong nectar flow can combine into swarm preparation well before you see capped queen cells. If your only inspection record is "hive looks strong," you've captured the surface symptom without the underlying trend that actually predicted it.
The Single-Visit Trap
A single inspection is a snapshot, not a trend line. A hive that looks "strong" in isolation might also be a hive that's been strong, stronger, and now critically congested across the last three visits — information you only see by comparing records side by side, not by reading the most recent note on its own.
The Data Points That Actually Predict a Swarm
Not every field in an inspection carries equal weight for swarm prediction. The ones worth watching closely:
- Brood nest congestion — how much open comb is left for the queen to lay in
- Queen cell presence — even early, uncapped cells, not just capped ones
- Population buildup rate — how quickly frames of bees have increased inspection over inspection
- Queen performance trend — laying pattern thinning out can precede supersedure or swarm prep
- Nectar flow timing — congestion during a strong flow raises urgency more than the same congestion in a dearth
- Local weather — a run of non-flight days right after a big flow traps a colony's bees, nectar, and ventilation problems all inside the box at once, which can push an already-congested hive over the edge
- Hive condition — a leaky or drafty box forces the colony to spend effort regulating temperature and humidity instead of just filling space, which can accelerate congestion in ways a well-sealed hive wouldn't show
Reading Patterns Across Inspections, Not Just a Single Visit
This is where a digital hive log earns its keep over a paper notebook. Pulling up the last four inspections for one hive side by side — not flipping through loose pages — is what actually lets you see congestion building before it becomes a problem. The pattern is the signal; any single inspection is just one data point in it.
How a Swarm Risk Score Turns Raw Notes Into an Early Warning
Interpreting trends by hand across dozens of hives doesn't scale, which is exactly the gap a swarm risk score is built to close. APiLOG's swarm risk score reads the same signals — congestion, queen cell activity, population trend, timing against the nectar flow — and surfaces which hives are at elevated risk before you'd catch it by memory alone. It doesn't replace the inspection; it tells you which hive to prioritize checking next.
See swarm risk scoring in action
Try APiLOG's hive health tracking and swarm risk flags hands-on. No signup required.
Acting on the Signal Before It's Too Late
A risk flag is only useful if it changes what you do next. Treat an elevated score as a prompt to check that hive sooner rather than later, add a super, split a congested colony, or re-queen a hive showing signs of supersedure — before cells are capped and the decision gets made for you.
Frequently Asked Questions
Can data really predict a swarm before it happens?
Not with certainty, but the leading indicators — brood nest congestion, early queen cells, and population buildup relative to the nectar flow — show up in the data before a swarm actually leaves. Reading those trends across inspections gives you a meaningful head start over reacting to capped queen cells alone.
How many inspections do I need before patterns become useful?
Even three or four consistent inspections on the same hive, spaced a week or two apart, are enough to see a congestion or population trend start to form. The key is consistency in what you record, not a long history.
What's the difference between a swarm risk score and just checking for queen cells?
Queen cells are a late-stage signal — by the time they're capped, swarm prep is already well underway. A swarm risk score weighs earlier indicators like congestion and population trend, so it can flag risk before cells appear at all.